
Our Workflow
We believe in your success and that real-time user experience data can help you achieve the best results for your business. Here's how we can help you.


Experiment Design
Before we start, we need to create a 'replica' of your user experience with your product/service. We will measure the experience in terms of emotional reaction (anger, happiness, excited, sadness or neutral). Then, we find an audience, which is your target market, to make initial tests. Once confirmed and validated (within 1 week), we can start large scale testing, deploying our kiosk around the island to be closer to your target market.
Kiosk
One kiosk module contains 4x Chiron Systems
5
5
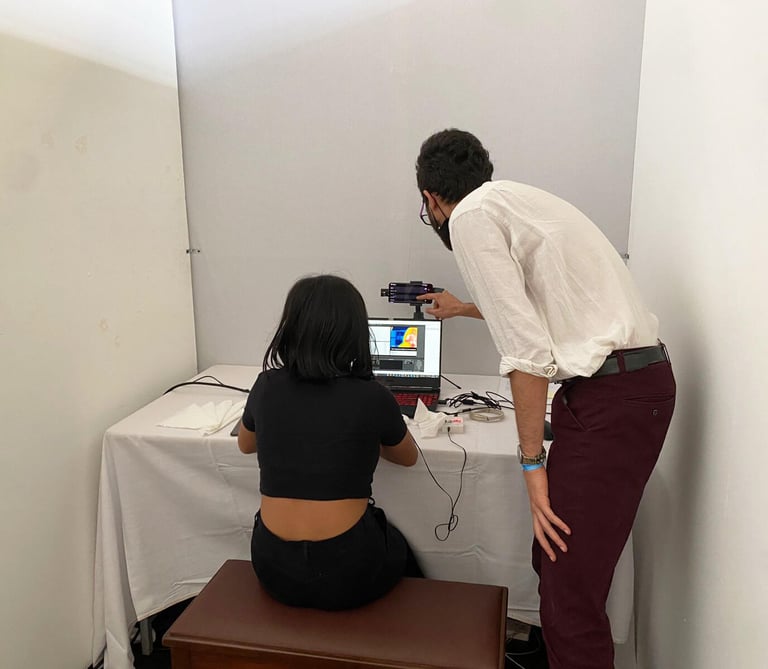
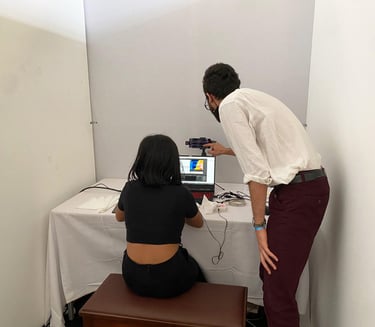
Evaluation Team
Responsible for acquiring data from your audience in a comfortable environment
2
Data Analyst
From the Ev-Team, the data analyst handles the data breaking it into sections for individual analysis.
Biometric Monitoring
The Chiron System™ integrates our propriety hardware and software for recording heart activity via PPG. Additional sensors include Galvanic Sensors (sweating), Infrared Camera (temperature) and Eye-tracking device.
Our software allows for data sync from various sensors to establish a multivariable system (polygraph)
Medical Standard Algorithm
Manufactured in Mauritius. Quantify emotional arousal of subject to experience.
PPG
IR Cam.
Facial Temperature
Embedded with Facial Recognition Technology. Track subject's facial response to experience.
I-Tracking
Pupil Tracking
Using the world-renowned hardware from Tobii, it allows us to track the eye movement.
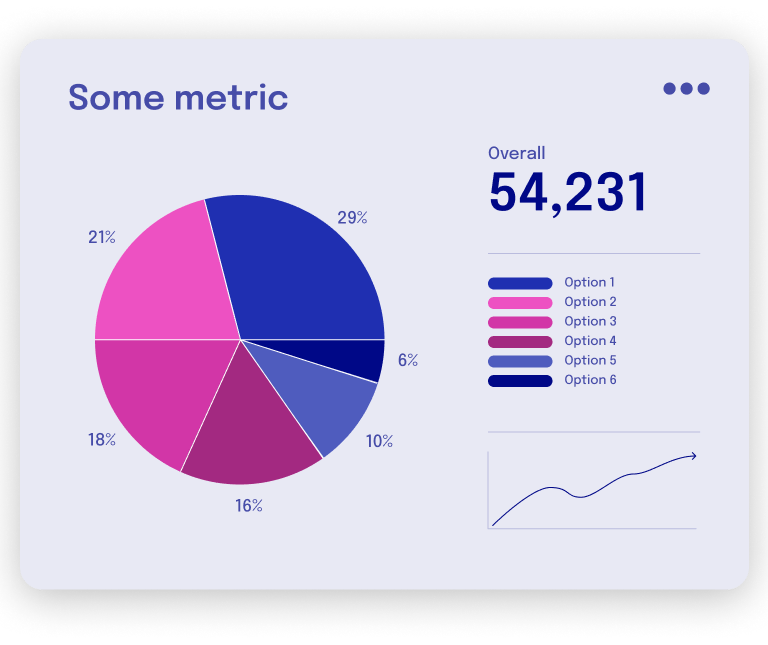
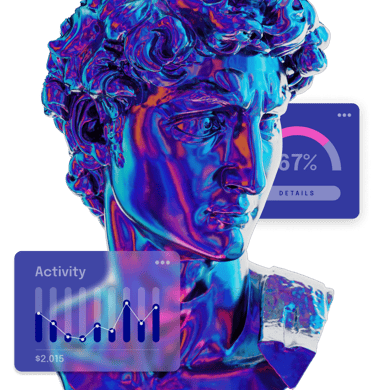
Data Processing & Analysis
You might have the best product or service in the world, but if you don't understand how users are interacting with your product/service, you could be missing out on opportunities. Our designers & engineers help you understand and implement the right data monitoring infrastructure solution for your brand and business, ensuring the tested audience is your target market.
We believe in the uniqueness of each business and their users
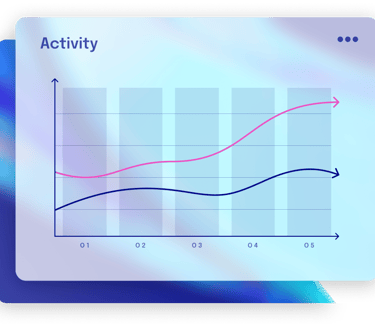
Data are analyzed and visualised as per the experiment expectation.
Different report formating
Consultancy
After analysis, we prepare a comprehensive Emotional Response Quantification™ (ERQ™) report of the average 'response' of the audience towards your product and service. We can also break down the experience into segments to further isolate each 'sub-experience' of the overall experience.
Imagine listening to a song, we can tell you which part of the song was most arousing and which was least.


Contact us
Whether you have a request, a query, or want to work with us, use the form below to get in touch with our team.

Location
81, Jerningham Street,
Curepipe, Mauritius
Hours
On-appointment basis only
Contacts
founder@chironbiometric.consulting