
Food: Honey Appreciation Test
Our next validated test is to compare the arousal emotional response from three different honey brands. What was the outcome ? Read about it below.
Introduction
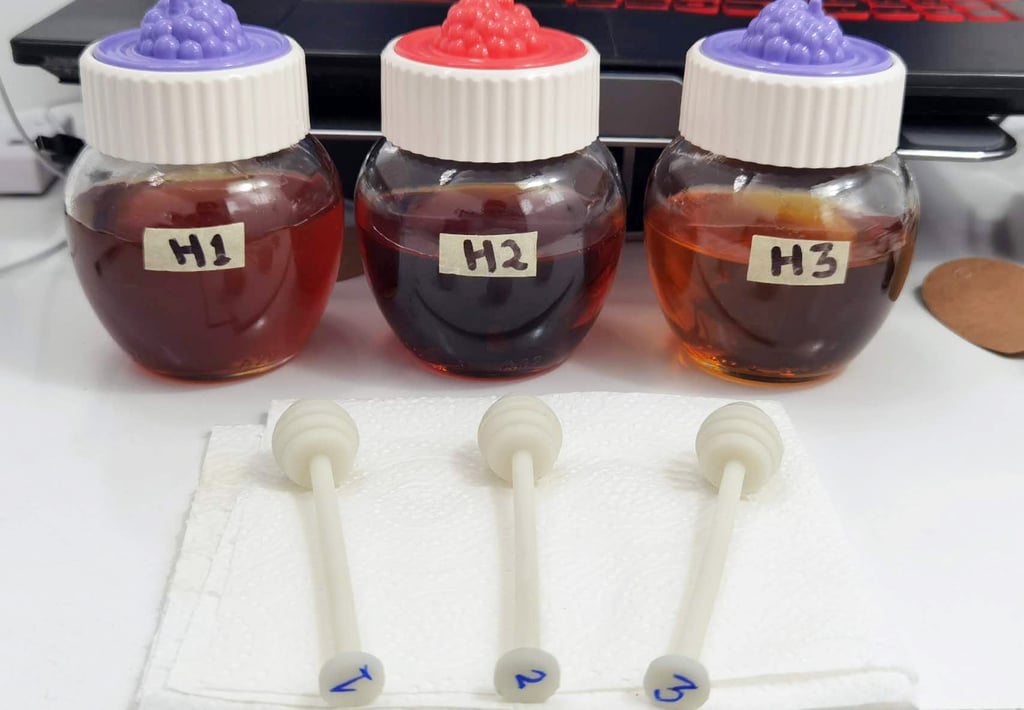
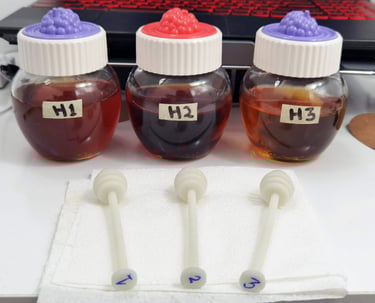
Recently, we had the chance to collaborate with a honey manufacturer in Mauritius, Miel D’or, for a small scale testing on comparative honey appreciation. The test, named honey appreciation test, aims at comparing a subject response to three different brands of honey. 3 unlabeled honey are tested: (H1) (100% honey, average quality), (H2) (15% honey, 85% sugar cane syrup) and (H3) Miel D’Or (100% honey, premium). The test was conducted via a 6-minute long instruction video. At the end, the subject was asked to choose the honey they liked best (by placing a heart-shaped cartoon next to it).
Our experiment hypothesis: The emotional response data support the choice of the subject’s favourite honey in terms of arousal appreciation score.
A preliminary test covering 15 subjects was conducted. The values shows that honey evoke a heart rate variability (HRV) change from baseline (validated hypothesis) in 95% of the cases.
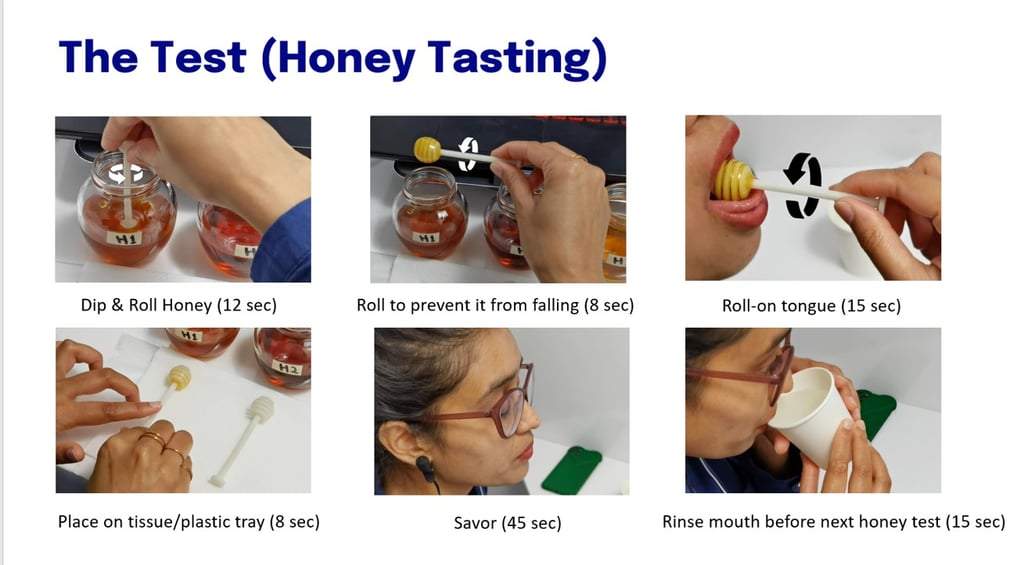
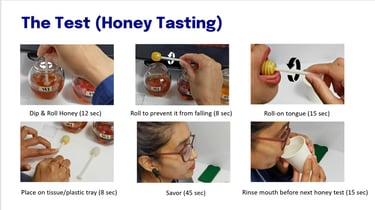
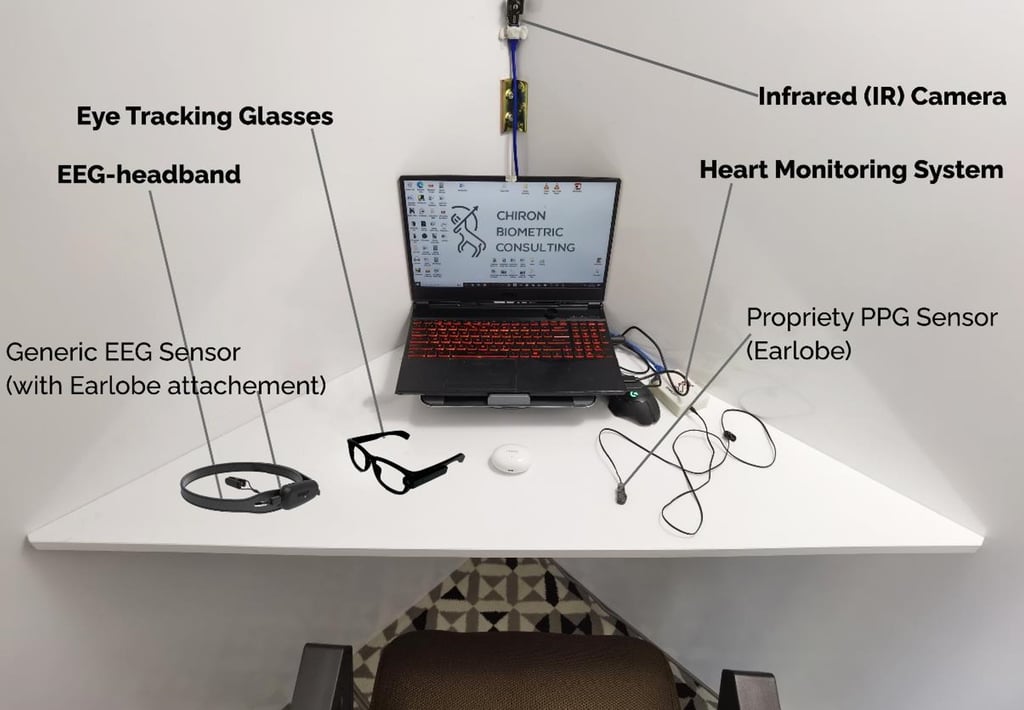
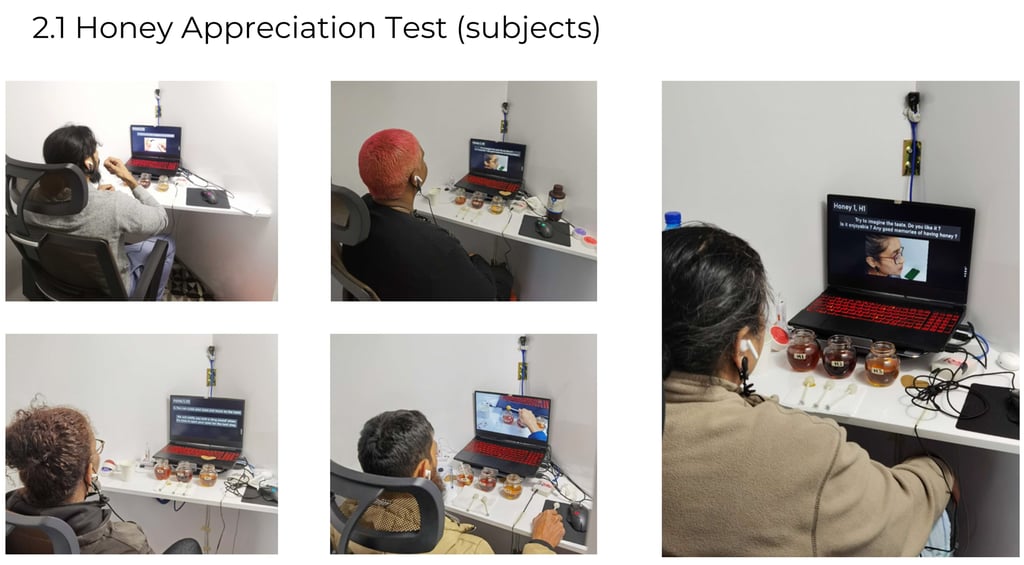
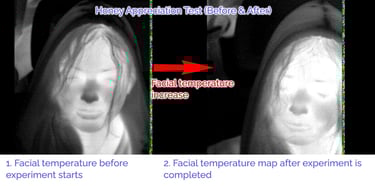
The monitoring process of a user consists of baseline reading and task experience reading which are conducted under the devices shown in the next page. The user is given a task to complete, the task consists of time-dependent events involving a sequence of activities that are performed by the user, shown in next page. The activities making up the task for the honey appreciation testing include the basic gesture to place honey in one’s mouth and savoring it. Even if the entire experiment last 360 seconds monitoring, 105 seconds of data was extracted for preparing the report which is the savoring time of 35 seconds for each honey. We added an extra 10 seconds as transitional emotion padding, 5 seconds before savoring and 5 seconds after savoring.
Conclusion
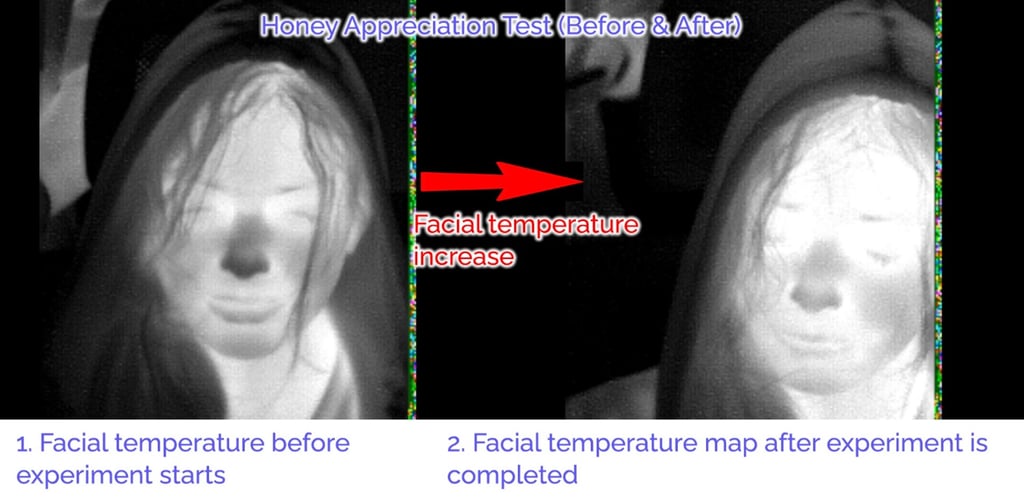
Result: Miel D’Or (H3) had the best reaction out of the 3 honey tested in the 15 subjects. 13 subjects preferred it most. (H2) had the worst (14 participants) response due to the ‘burnt caramel taste’. When asked ‘why’ H3 was preferred, the response was that Miel D’Or had the most ‘viscous’ texture with a smooth sweet taste (non-bitter) and it looked better (golden color). Report can be provided separately. The average RMSSD offset graph is given below, it’ll be explained further in the upcoming sections because the graph embed our post-processing algorithm including visualization. For simplicity, it should be understood that the more negative the value, the more appreciation occurred during the experience.
The full report can be provided along with the GUI program showcasing each subject data and an averaged data of the experience. As a conclusion, eating/drinking something you like triggers a positive response which can be monitored. However, it depends on what you are eating/drinking, drugs such as alcohol, cigarette or strong coffee need to be completed as fast as possible to avoid the kicking in of the chemical effects which will affect the overall data.

Location
81, Jerningham Street,
Curepipe, Mauritius
Hours
On-appointment basis only
Contacts
founder@chironbiometric.consulting